Beyond The Headlines
Asset rich, but income poor
With interest rates dropping and yields disappearing while asset prices hover at all-time highs, we find ourselves in a highly unusual predicament. Over the last few years, in many conversations with clients, friends and fellow investors, I have come across a recurring phenomenon. On one hand, over the last ten years they have witnessed an unprecedented rise in the prices of their assets. However, they see that it takes a lot more capital to generate the level of income they’re accustomed to. In other words, they are asset rich, but income poor.
Tech billionaire moves back with his parents!
Sometimes as a mental exercise, I like to extrapolate ideas to their logical limits. Picture a young tech billionaire who takes a $1 annual salary (which is not that rare these days). Meanwhile his entire worldly possessions consist of a few t-shirts with the name of the college he dropped out of, and a billion dollars’ worth of highly-appreciated company stock. It’s obviously a very fast-growing company, but earns no profit yet. It issues no dividends, hence generates no income, making this tech billionaire the ultimate example of someone who is asset (super) rich, but income (super) poor! If we take this idea to its limits, he might actually need to move in with the parents to get by, unless he starts selling shares of his company. It’s an extreme situation, but today more and more of us find ourselves in somewhat analogous circumstances. Not that we all have a billion dollars, but if we hold valuable assets, we can be often described as asset rich, yet income poor.
We might be living in a multi-million-dollar home that has appreciated beyond our wildest predictions. Or perhaps we hold a portfolio of stocks whose value has increased in the last ten years higher than anyone could have foreseen. Many individuals have become asset rich in these ways. But at the same time, the income that such assets might generate has diminished to levels that are also unprecedented. Let me explain.
Asset prices go up
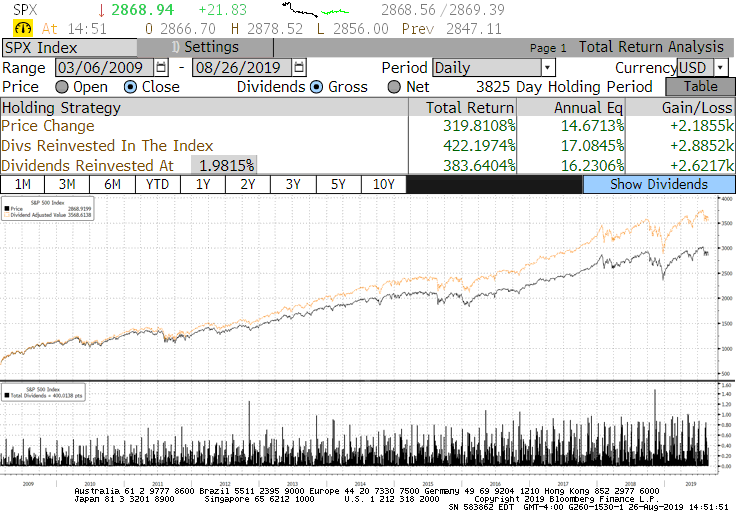
Most of us remember, with some retrospective pain, the S&P 500’s long brutal years of sideways markets marked by two major sell-offs between 2000 and 2013. Yet in the ten years since the darkest days of the Great Recession, stocks have been on the rise. The S&P 500 is up 320%. Nasdaq is up 504%, and the Nasdaq 100 is up a round 600%! (Data through August 2019 is included here, Source: Bloomberg). It’s unlikely anyone was 100% invested in the Nasdaq 100 to sextuple their money, but surely but many investors multiplied their wealth over the last 10 years. Yes, this is an unprecedented gain. And yes, seeing a repetition over the next 10 years is highly improbable.
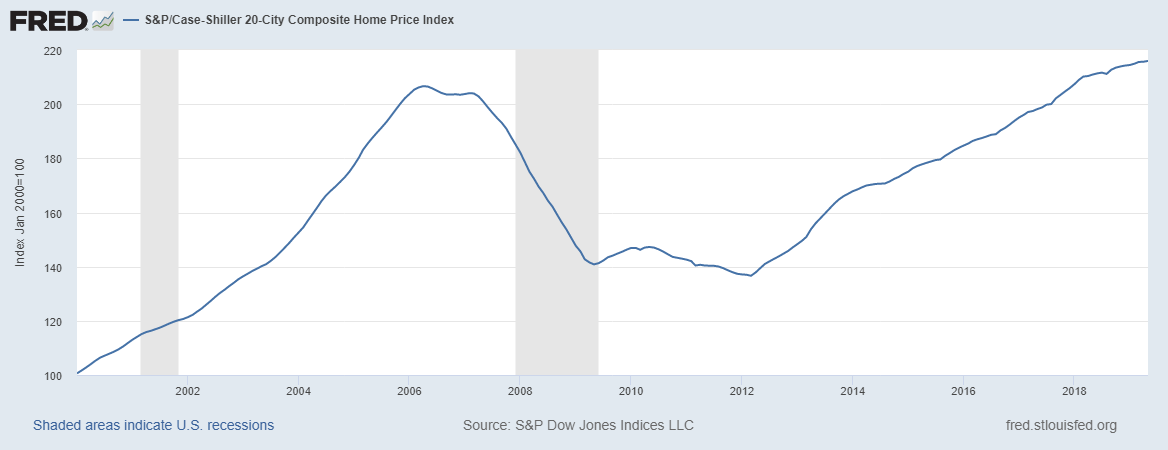
At the same time, home price indices in top cities around the globe have shown a mindboggling recovery from 2008 lows, in many cases flying past the 2007 highs. If you bought a house at the last peak or today’s peak, you may have little equity in the house, and you’d be more of a renter than an asset holder. But if you bought before the 2007 peak or during the post-Great Recession years, you might have built up a decent-size equity in your appreciated home.
S&P 500 (Performance since the Great Recession, Source: Bloomberg)
Home Price Index 20 Cities (Last 20 years, Source: S&P 500 Dow Jones Indices, and Fred)
Incomes fall
As the asset prices rose, the income from those assets was falling faster than ever, driven mostly by the infamous zero-rate interest policy.
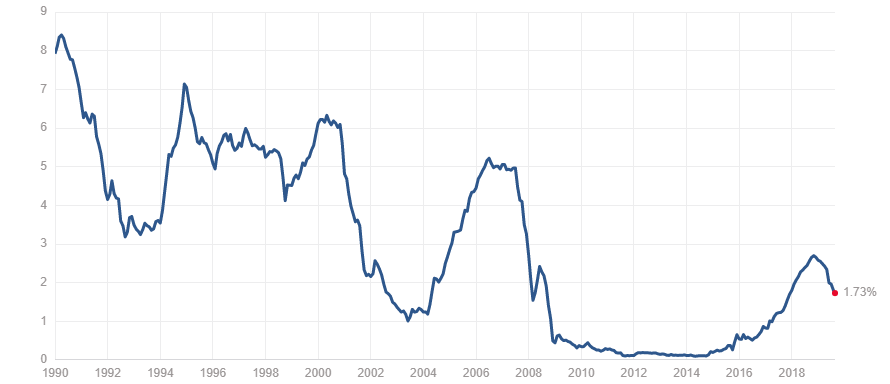
The one-year US treasury rate stayed close to zero for 7 years (2009-2016). It recently peaked at 2.6%, and it’s headed downward again, which means that unless we are willing to commit our money for many years, we might not be paid anything for lending it to the government or leaving it with a bank.
Last year for the first time in 12 years, I opened a certificate of deposit with a bank, but the era of “whopping” 2%+ one-year CDs might be over soon. The chart below shows that the current 1-year treasury rate is 1.73% and dropping, but it’s important to remember that even a 5-year rate in real terms (i.e. taking into account reported inflation) is actually a mere 0.05%. In other words, the US government gets 5-year loans from bond holders by paying 0.05% annually (in real terms).
Having grown up in 1990s Poland soon after hyperinflation ended, I vividly remember my parents putting money into one-year CDs that paid double digit % interest. But in addition, given rapidly diminishing inflation, the real rate of return was also in double digits. Forget stocks, get one-year CDs and keep rolling them over — that was a solid money-making strategy for quite some time!
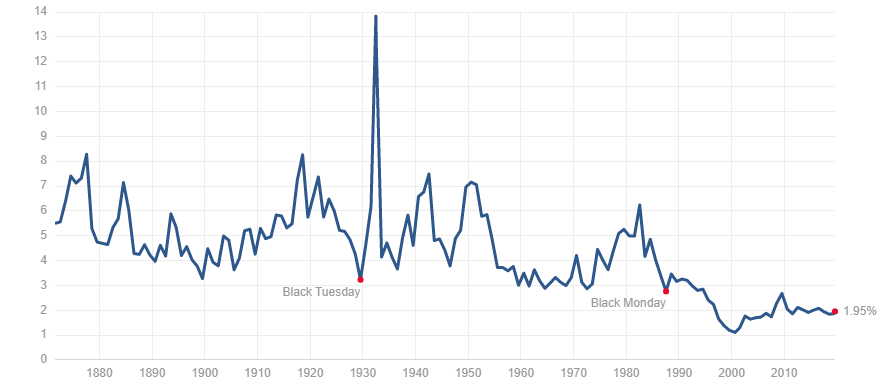
Today, it’s not just bond yields that are falling. At the same time, we have seen a decline in the dividend yield of the S&P 500 to under 2%, the second lowest level in its history (the nadir was the peak of the internet bubble). Any study of real estate cap rates (income yield) show a similar decline.
1 Year Treasury Rate (1990-today, Source: Robert Shiller)
S&P 500 Dividend Yield (1870-today, Source: Robert Shiller)
US dollar investors may complain about plummeting rates and yields, but outside of the dollar world, the developed countries of the eurozone or the yen are even worse off. They have seen a vastly-increased number of bonds with negative yields. Today about ¼ of the government bond market worldwide has a negative yield, and that share will likely only go up, given the current direction of monetary policies. In Europe, no major economy besides Italy has even a 30-year bond yield that exceeds 1%! Now, if we exclude the 40% of the government bond market worldwide that is the US treasuries, then over 40% of the non-US government bond is currently offering negative yields!
World Bond Markets (August 30th, 2019)
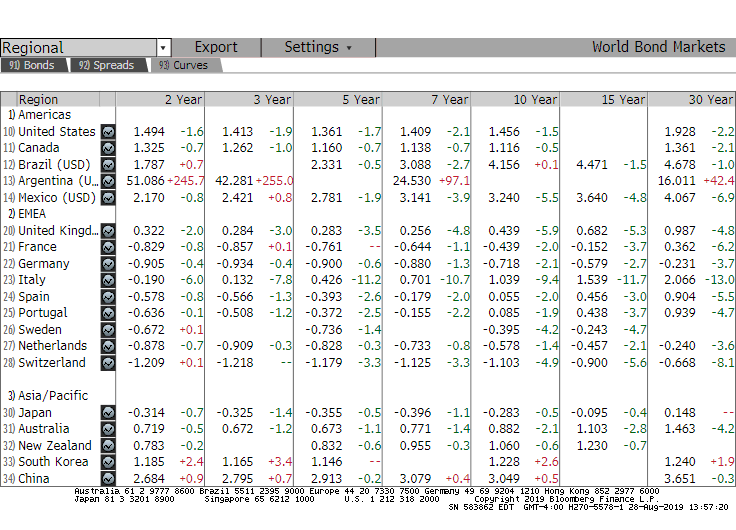
Source: Bloomberg
A million is not what it used to be
Some time ago I was asked if a million dollars is still enough of a nest egg to retire on. Apparently, there’s a belief that if you save a million dollars and put it in safe investments such as dividend-paying blue-chip stocks, certificates of deposit, treasuries, etc, you will be able to live off the income. Well, if that portfolio can generate a 5% income yield (not unheard-of historically), a million can generate $50,000 in annual income. That could be supplemented with some appreciation for a comfortable amount.
However today, with yields at historical lows or heading that way, a 2% to 2.5% yield is a more likely range for a portfolio of quality stocks and bonds. In that case, our income from each million dollar of assets just got cut in half to $25,000. Further, if for safety, we want to hold more in short-term US treasuries (which could soon pay as little as 0.15% if the rates head back to where they were only 3 years ago), then our imagined income might drop not to $25,000 from each million dollar’s worth of assets, but to as little as $1,500.
Low yields make it harder to retire early, so investors may need to stash away an even larger nest egg to contemplate living off income alone. Given the rising costs of housing, education and health care, not only is a million is not what it used to be – even the income it can throw off is diminished. This phenomenon can feel like a double whammy to many savers and investors.
Understanding the why
My parents like to remind me that ever since I began to talk, my favorite question was “Why?” So why do these conditions prevail now?
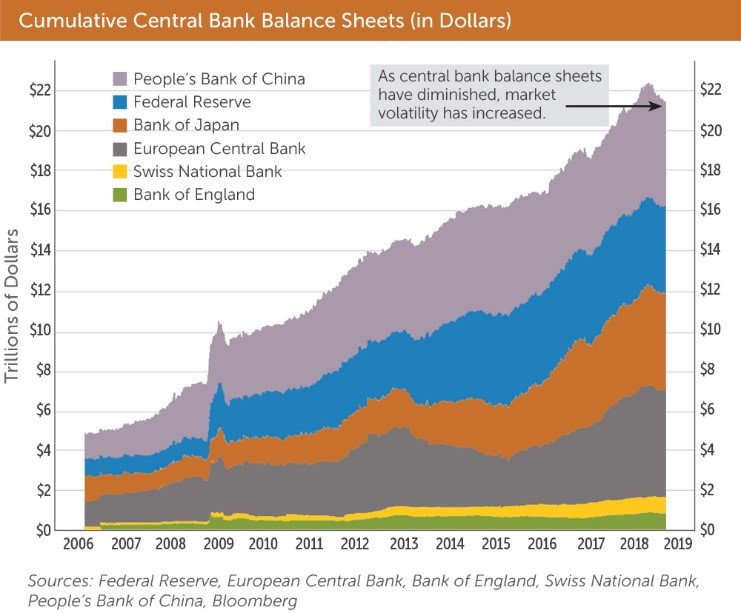
The answer is that asset prices are sky high; income generated by those assets shrank to the minimum and is now hitting uncharted negative rate territory. Maybe pumping over $20 trillion of new money into a $80 trillion world economy had something to do with it? That’s what central bankers decided to do in the name of helping economies recover from the Great Recession. We are trying to solve the debt crisis with MORE and CHEAPER debt…
When your hard-earned dollars, euro, yen etc. have to compete with freshly printed money, they don’t stand a chance. In my upcoming book (Money, Life, Family, My Handbook), I liken this scenario to taking a bath with a hippo; we all know who will end up outside of the tub, cold, wet, and naked—and it’s not the big guy with the gray hide.
Economic recovery or war on savers?
The Great Recession led to some unprecedented fiscal and monetary policies. Governments borrowed more, and central bankers lowered the cost of borrowing to zero. To help push that cost down, they sometimes used the central banks’ balance sheets to buy up assets –typically bonds — to depress the yields further by inflating their prices. The goal was to make people borrow and spend, in order to boost the economy as fast as possible. In fact, it was spending and borrowing that got us in trouble in the first place.
With zero rates the incentive to save is diminished, especially since bond yields are so low. We may also see low rates or negative yields (especially real rates, adjusted for inflation) as a wealth tax of sorts. A pay cut for the rich, you could say. Or just a pay cut for those that have anything saved up for rainy days, retirement or the future. Not only do we not get paid, but even a small inflation slowly erodes our wealth.
That’s a point that few years ago was brought up to then-Federal Reserve Chairman Ben Bernanke. He had a fittingly witty answer to it: “It’s ironic that the same people who criticize the Fed for helping the rich also criticize the Fed for hurting savers.” His answer sums up our predicament. With diminishing yields, investors felt forced to chase riskier assets and look for appreciation in lieu of the lost income. We got asset rich, BUT income poorer.
What to do then?
Ben Bernanke is gone from the Federal Reserve, as is Janet Yellen, and now Jerome Powell is getting ready to kick the proverbial can even further down the proverbial road. Those of us with long-term investment horizons have nowhere to go in the current economic and financial context.
What do we see? Higher risks, and need for more caution.
On one hand, asset prices are inflated, which poses a very serious risk to the investor’s principal. The higher the prices go, the bigger the drop we could expect. On the other hand, yields are low which may steer investors to less-than-sound assets such as the 100-year bond issued a few years by Argentina. Apparently, there were plenty of investors who had forgotten the long history of Argentine defaults, and today, that bond trades at 40 cents on the dollar (which is a 60% loss!)
Bonds carry another risk that is more pronounced the longer maturities are, and the more dramatic the interest moves become as we get closer to zero. For example, a 30-year bond that pays 2% will drop a whole 20% (its duration is about 21 years) if the rates go up by 1 percentage point. If we were to hold the bond until maturity (30 long years) we will receive the whole principal, but if we were to sell it after a rate increase like that, we’d be facing a roughly 20% loss. The lower the rates are, the further we reach out with bond maturities seeking some yield, the HIGHER the risk to principal we take on.
As we at Sicart call ourselves investors with an infinite horizon, we try to understand the risks before we reach for rewards. Our investment approach is not only to select what we would like to own, but also to identify what we choose never to own. We passed on the 100-year Argentine bonds and steer clear of most emerging-market bonds for that matter. We seek yield, but we remain disciplined and cautious. Dividends are a big consideration when we pick stocks for our clients’ portfolios because in sideways markets, dividends matter even more. Yet we never overlook the risk to the principal.
It’s not just stocks and bonds where trouble might be hiding; we also remind our clients that not all money market funds are all the same. For seven years, money market funds, checking accounts, and most savings accounts paid zero in US dollars. In the last three years, given briefly higher interest rates, we saw a 1-2% yield in money market funds. We actually took the time to learn why some market money funds pay a little more versus the others: it turns out the assets they hold are not the same, and don’t have the same risk profile. Money market funds broke the proverbial buck during the Great Recession: their value fell below par. Sometimes chasing the additional 5-10 basis point of yield isn’t worth the risk.
Or is it an opportunity in disguise…
It might be the worst of times for income seekers, but it might be the best of times for asset holders. This peculiar predicament gives us a great opportunity to move investments from high- risk, highly-inflated assets to those that are more attractively priced, and could offer a growing income over time. If you are a tech billionaire and want to move out of your parents’ basement, maybe this would be a good time to trade some of your shares for dividend-paying quality stocks available at good prices. If you are sitting on an appreciated portfolio of stocks, this might be the moment to consider whether they’re the best stocks to hold for the next 5-10 years.
Although the U.S. market is stuck range bound for 18 months now, this doesn’t tell you the whole story. After few market sell-offs in the last couple of years we see lots of stocks that are down 30-50% or more, some trading at 5- to 10- or even 20-year lows. Many of them, it’s true, for the right reasons; but others show plenty of potential to recover, grow, and even pay a decent dividend.
It might be the worst of times for passive investors and closet indexers, but it’s getting to be an increasingly exciting time for active managers and true stock pickers who take the time to see what they buy, and why!
Happy Investing!
Bogumil Baranowski | Published September 4nd, 2019
